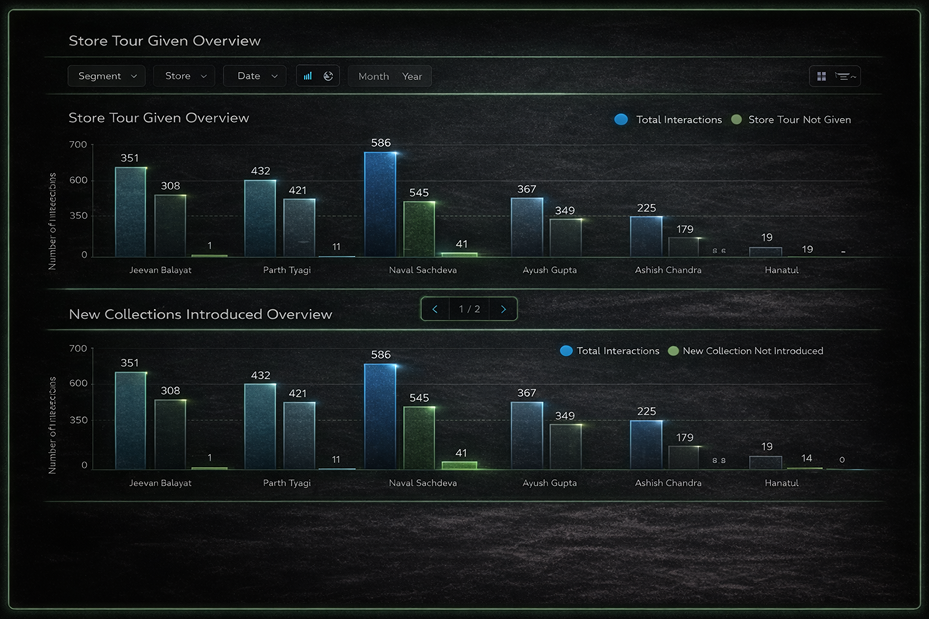
See how consistently sales conversations follow your standards.
- Compare overall interactions with key SOP steps being followed.
- Spot where process adherence varies across executives and stores.
- Support coaching that improves execution consistency over time.
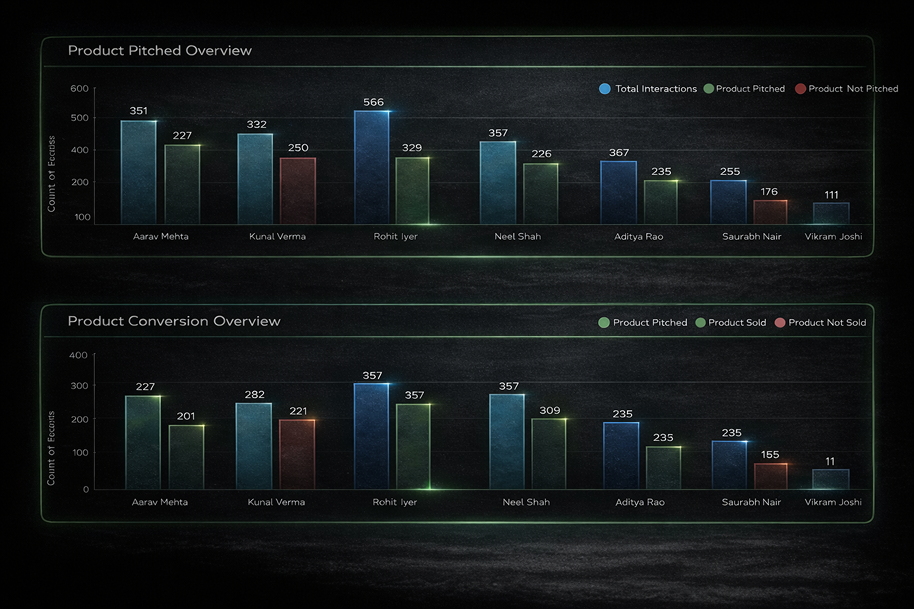
See how effectively pitches translate into sales.
- Improve consistency in how high-value offerings are positioned to customers.
- Strengthen conversion by aligning pitch execution with sales outcomes.
- Build disciplined selling habits that scale across teams and stores.
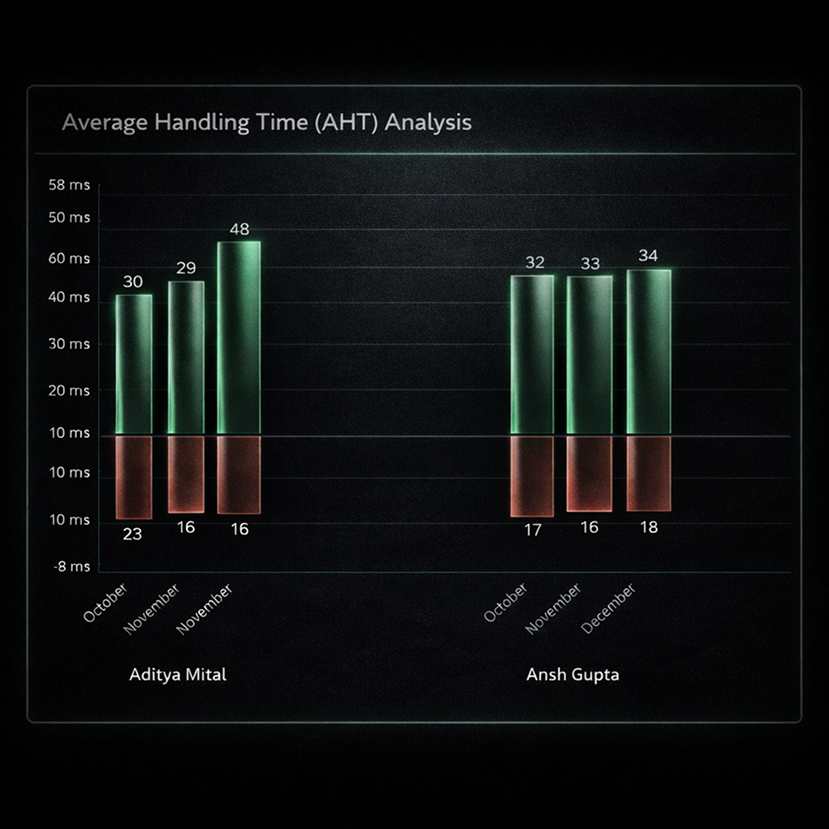
Improve outcomes by aligning handling time with intent.
- Understand how conversation time relates to successful outcomes.
- Identify the handling time range that consistently supports conversion.
- Spot pacing patterns over time that signal coaching or efficiency needs.
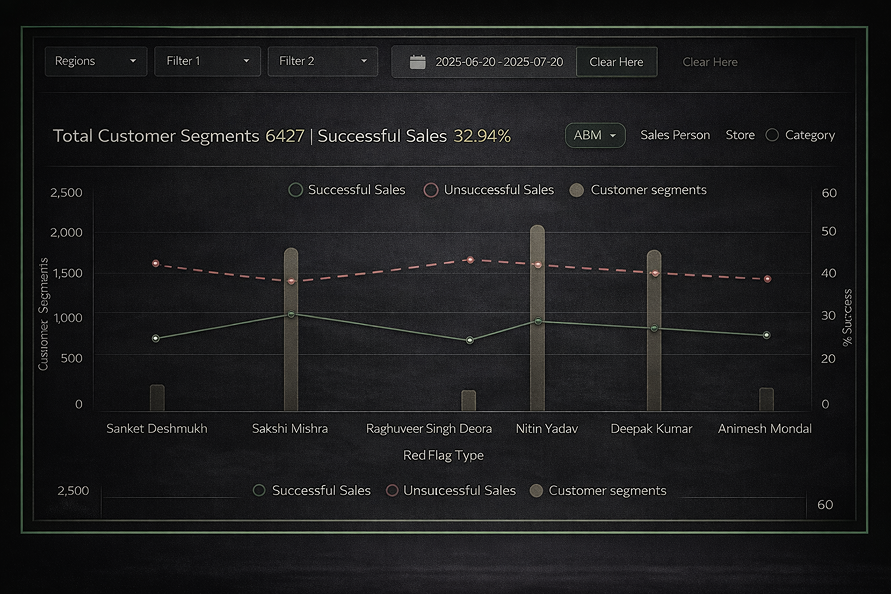
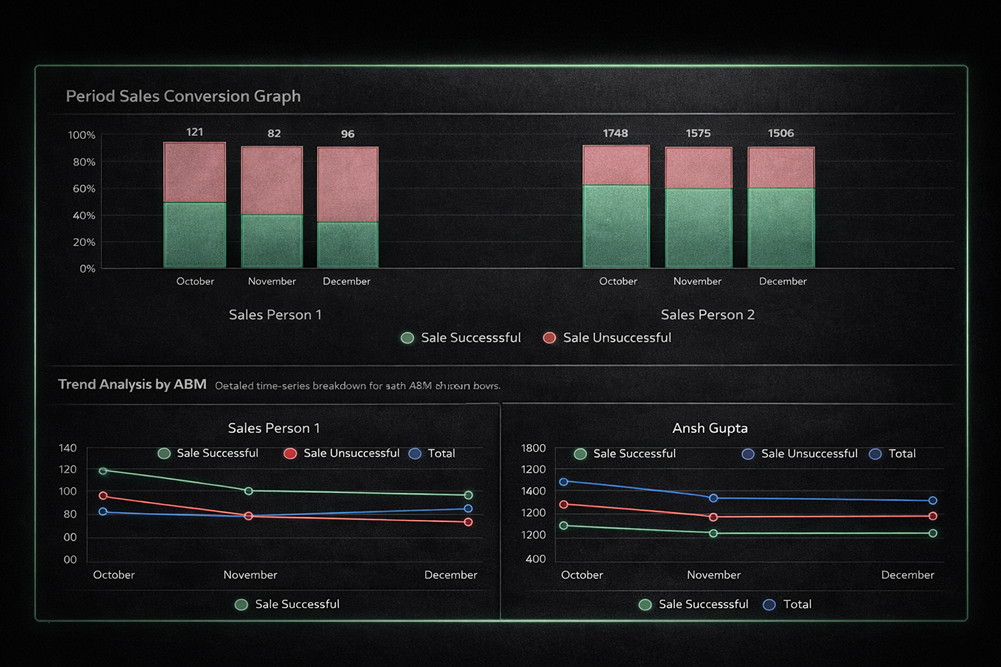
See how consistently opportunities turn into outcomes over time.
- Improve consistency in how high-value offerings are positioned to customers.
- Strengthen conversion by aligning pitch execution with sales outcomes.
- Build disciplined selling habits that scale across teams and stores.
See how consistently sales conversations follow your standards.
- Understand how sales outcomes vary across teams.
- See how pitching and closing consistency changes over time.
- Guide coaching with evidence, not assumptions.
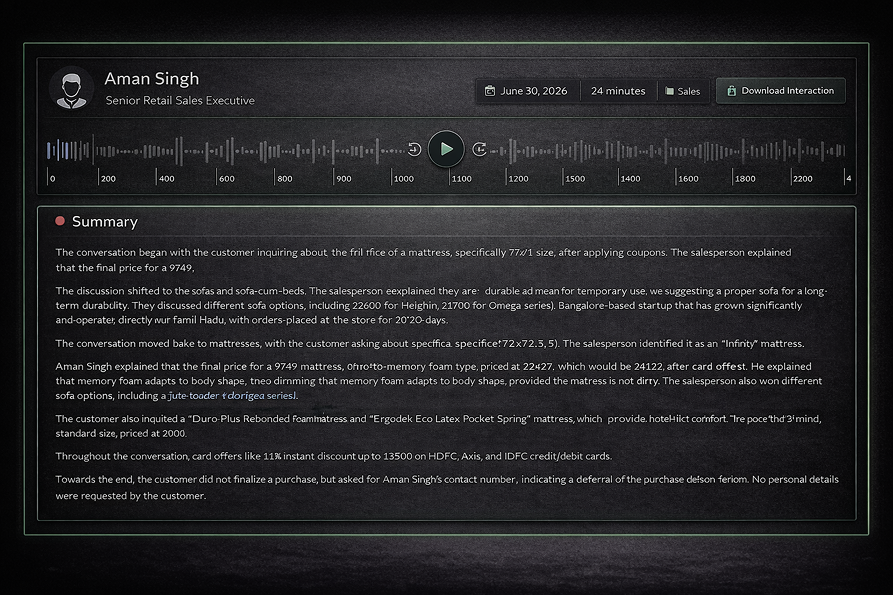
Gain full clarity into how customer conversations actually unfold.
- Review every conversation end to end, with the option to listen closely.
- See what mattered without replaying everything.
- Focus attention on the conversations that matter most.
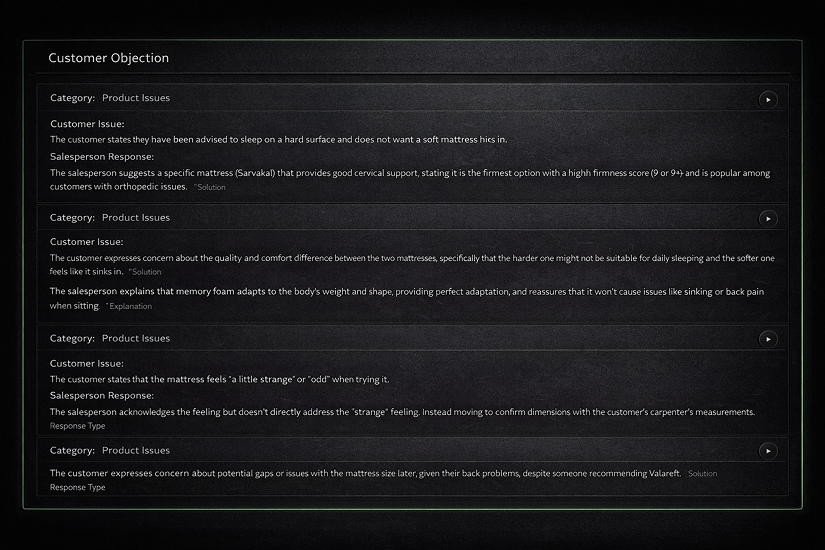
Improve objection handling with evidence from real interactions.
- Understand the types of concerns customers raise most often.
- Assess how responses address those concerns in the moment.
- Improve coaching by grounding it in real customer interactions.
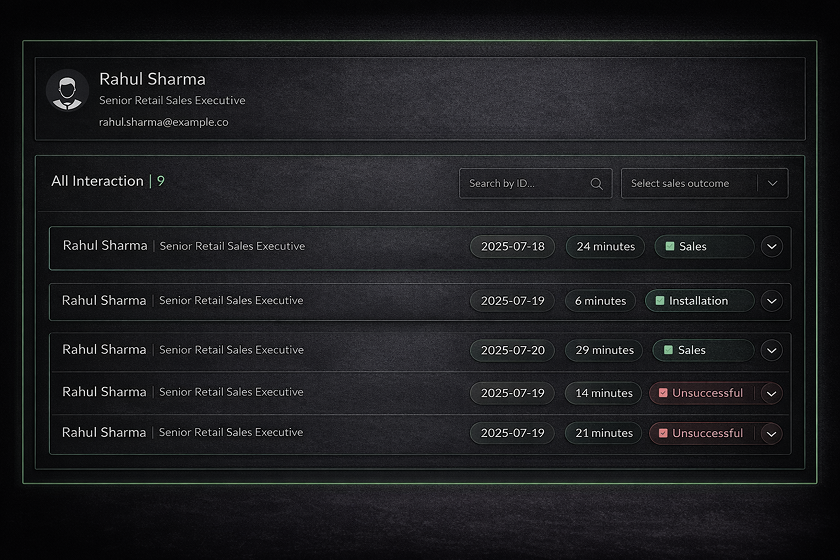
Get a complete interaction history for each sales executive.
- Track conversations by date, duration, and outcome.
- Compare successful vs unsuccessful interactions.
- Spot behavior patterns for focused coaching.
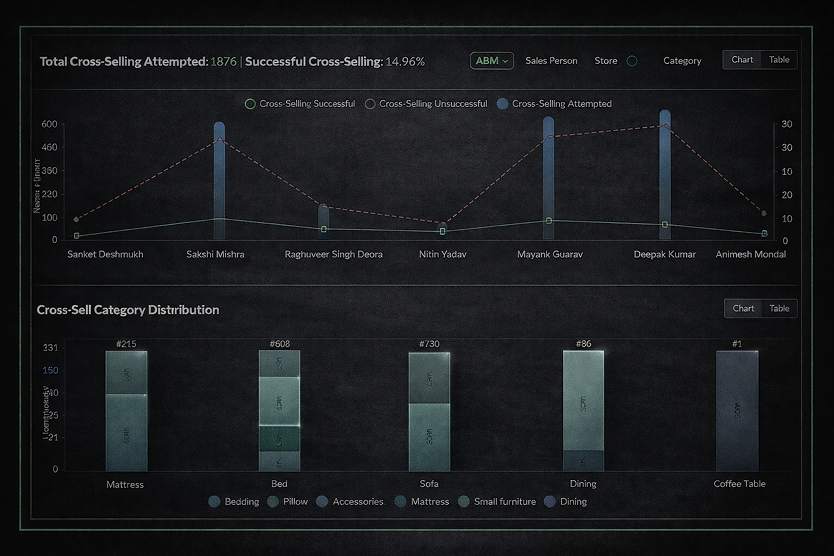
Make cross-selling performance clear and repeatable.
- See which product combinations consistently convert.
- Understand where cross-sell execution breaks down.
- Focus coaching and effort on moments that drive incremental revenue.
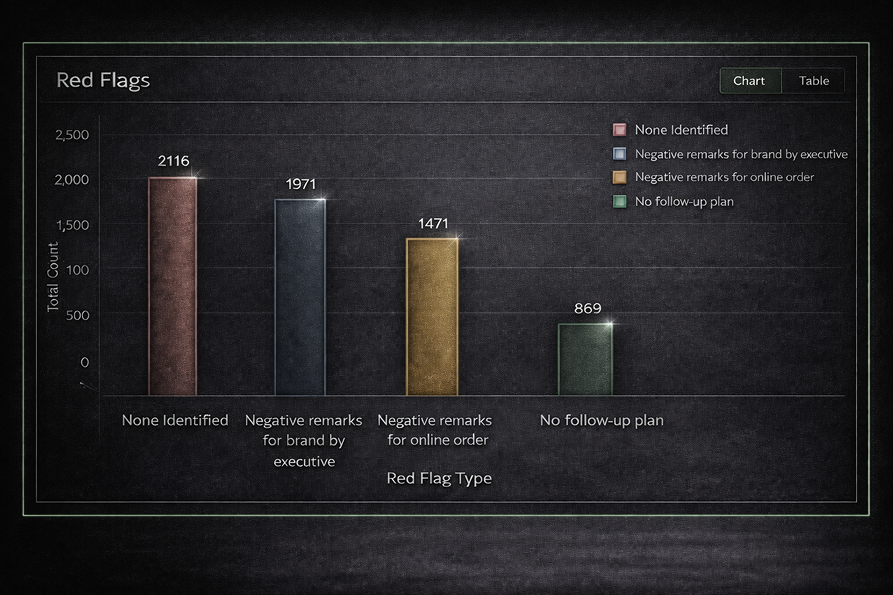
Catch risky behaviours before they affect revenue or trust.
- Identify negative remarks, missed follow-ups, and compliance gaps at scale.
- Pinpoint issues caused by sales behavior, process lapses, or channel conflicts.
- Prioritize coaching on high-risk patterns, not isolated incidents.